
PerfView
Debug CPU and memory issues fast
Description
With PerfView, you can rapidly debug CPU and memory-related problems by leveraging ETW data in ETL files and CLR heap dumps. The tool provides a cohesive environment to gather and review performance information, emphasizing user-friendly data presentation. Detect performance bottlenecks, analyze memory usage, and gain insights into application behavior, all designed to accelerate troubleshooting and enhance your development workflow.
Screenshots
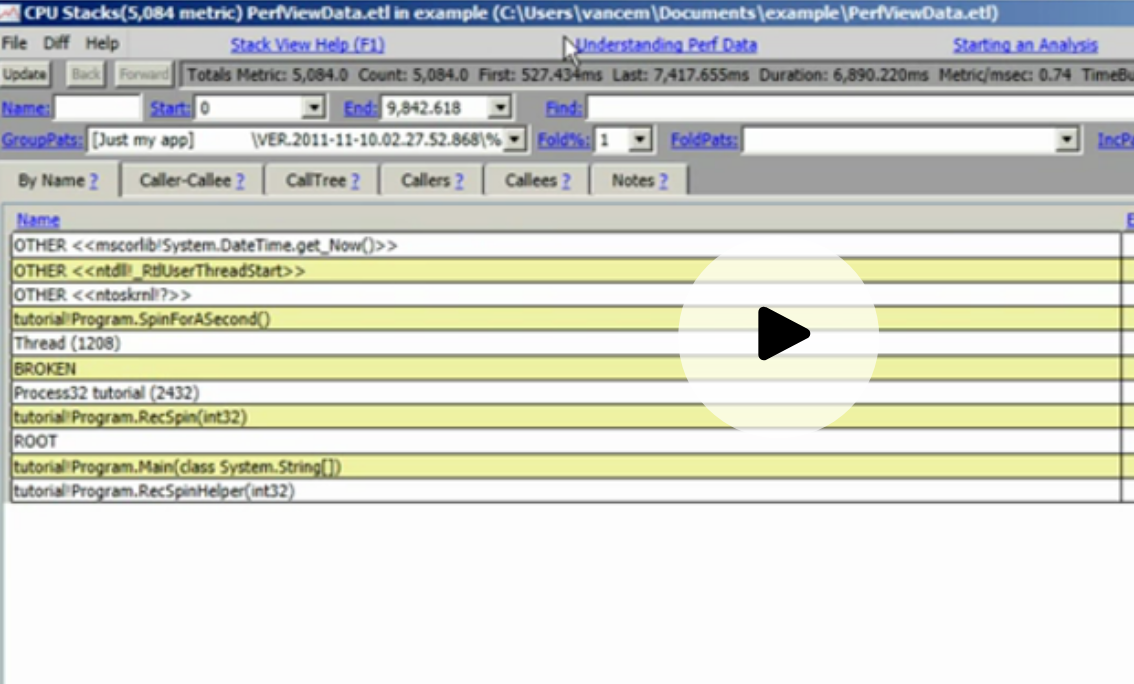
Click to view full size